

Exhibit Graphics in Marketing: Boosting Trade Show Impact
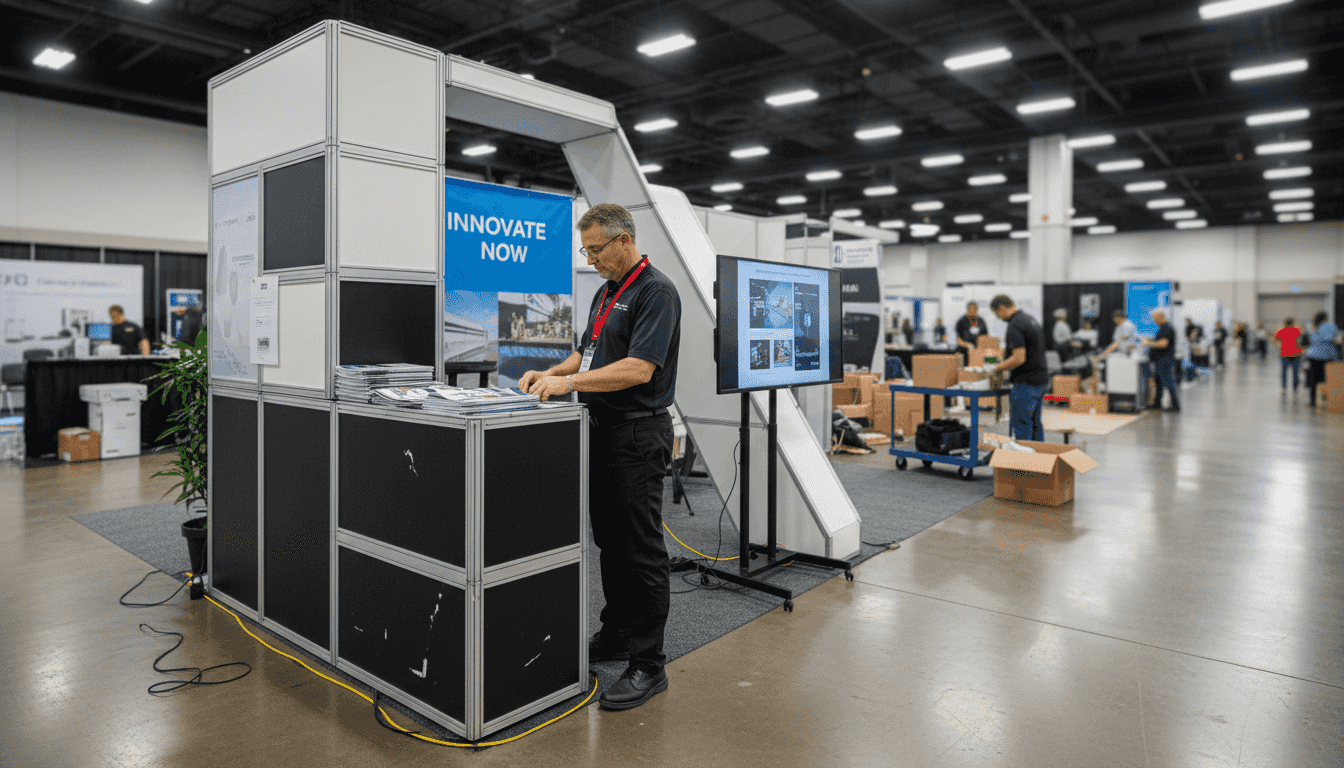
Thousands of brands compete for attention at every trade show, leaving even the most experienced marketing managers searching for new ways to stand out. In such crowded venues, exhibit graphics become more than just decoration—they represent the visual link between your European tech company’s innovation and every potential client walking the floor. This article guides you through the strategies and types of exhibit graphics that build brand visibility, foster meaningful engagement, and transform your booth into a memorable experience.
Table of Contents
- Defining Exhibit Graphics In Modern Marketing
- Types Of Trade Show Exhibit Graphics
- Strategic Functions And Brand Engagement
- Best Practices For Impactful Graphics
- Measuring ROI And Common Pitfalls
Key Takeaways
| Point | Details |
|---|---|
| Importance of Exhibit Graphics | Exhibit graphics are essential for attracting visitors and communicating your brand story effectively at trade shows. |
| Evolution of Graphics | Modern exhibit graphics now integrate digital and interactive elements to enhance engagement and create immersive brand experiences. |
| Strategic Functions | Graphics must not only capture attention but also tell a compelling story and facilitate easy conversations for converting leads. |
| Measuring ROI | Establish clear objectives and track specific metrics to assess the effectiveness of your trade show presence over time. |
Defining Exhibit Graphics in Modern Marketing
Exhibit graphics are far more than decorative elements at trade shows. They serve as strategic tools that communicate your brand story, capture attention in crowded venues, and drive meaningful engagement with your target audience. For European tech companies, these graphics represent a direct connection between your innovation and the attendees walking your booth.
At their core, exhibit graphics are visual components designed specifically for trade show environments. They include backdrops, digital displays, signage, banners, and environmental graphics that transform your physical space into a branded experience. Each element works together to reinforce your message and reflect your company’s values.
Why Exhibit Graphics Matter in Modern Marketing
Trade shows present a unique challenge: thousands of competing booths vying for attention. Eye-catching exhibition stand graphics make the difference between being noticed and being overlooked. A well-designed graphic can stop attendees mid-stride and pull them into your booth.
Modern exhibit graphics serve multiple functions:
- Attract visitors from across the show floor with compelling visual design
- Tell your brand story through strategic messaging and imagery
- Communicate complex information in seconds, not minutes
- Create memorable experiences that attendees remember long after the event
- Reinforce brand identity across all touchpoints at your exhibit
- Support your sales team by generating qualified leads through engagement
The difference between a successful booth and a forgotten one often comes down to visual impact. Graphics create that first impression that determines whether someone stops or walks past.
The Evolution of Exhibit Graphics
Exhibit graphics have transformed alongside marketing strategy itself. Ten years ago, static printed graphics dominated trade show floors. Today’s approach integrates digital displays, modular components, and interactive elements that respond to attendee behavior. This evolution reflects a shift toward immersive brand experiences that engage multiple senses.
For tech companies, this means graphics must convey innovation and sophistication. Your visuals communicate before anyone reads a single word. They signal whether your company is cutting-edge or traditional, forward-thinking or established.
Your exhibit graphics are your brand’s first ambassador at a trade show. Make them count.
Key Components of Effective Exhibit Graphics
Effective exhibit graphics combine several essential elements:
- Color psychology that evokes the right emotions and reflects your brand
- Typography that’s readable from 10 feet away, not just close up
- Imagery showing your products, team, or innovative solutions in action
- Hierarchy guiding eyes toward your most important message first
- Brand consistency matching your website, marketing materials, and company identity
- Messaging addressing attendee pain points or desires in clear language
Each component must work in harmony. A beautiful graphic means nothing if it doesn’t communicate your value. Conversely, clear messaging falls flat without visual appeal.
Pro tip: Start with your single most important message, then build everything else around it. Avoid crowding your graphics with competing messages that dilute your impact and confuse visitors.
Types of Trade Show Exhibit Graphics
Trade show graphics aren’t one-size-fits-all. Different types serve distinct purposes, and the best booths use a strategic combination tailored to their goals. Understanding each type helps you allocate budget effectively and maximize your booth’s impact.
Your choice of graphics depends on several factors: booth size, budget, messaging complexity, and the specific audience you’re targeting. European tech companies often benefit from mixing multiple types to create a cohesive, layered visual experience.
Primary Types of Exhibit Graphics
Backdrops and wall graphics form the foundation of most exhibits. These large-format graphics create an immediate visual impression and define your booth’s atmosphere. They’re typically the first thing attendees see and should communicate your core brand message instantly.
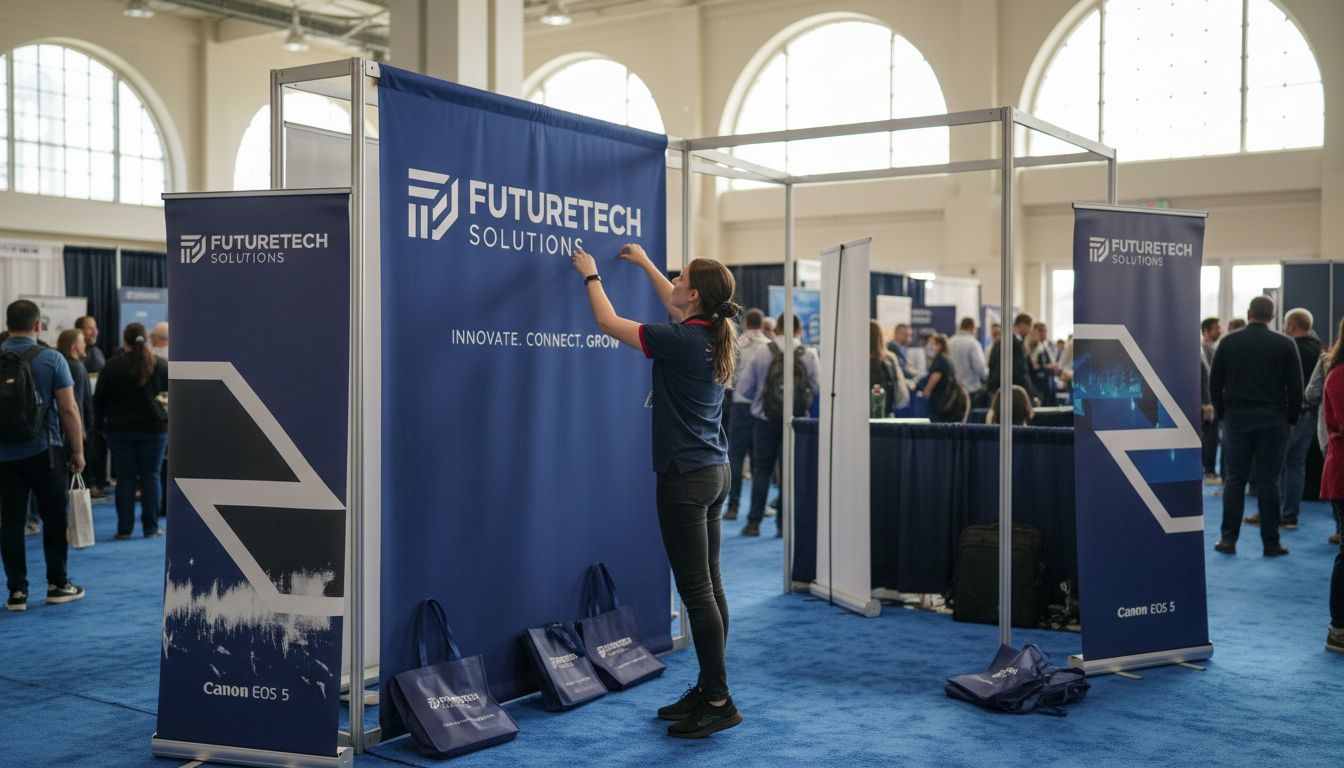
Banner stands offer flexibility and portability. They work well for highlighting specific products, achievements, or services. Unlike backdrops, banners can be easily swapped between shows or repositioned within your booth to test different messages.
Floor graphics and walkable surfaces create engaging entry points. Creative trade show booth ideas often incorporate floor graphics that guide attendees through your space or reinforce brand messaging as they navigate.
Digital displays and LED screens bring your graphics to life with motion and interactivity. For tech companies, these convey innovation and sophistication. They’re ideal for showcasing product videos, live demonstrations, or real-time data.
Custom structural graphics wrap around booth elements, creating immersive environments. These might include 3D signage, custom-shaped elements, or graphics integrated into your booth framework itself.
Here’s a comparison of the main types of exhibit graphics and their ideal uses:
| Graphic Type | Best For | Typical Impact |
|---|---|---|
| Backdrops & Wall Art | Core branding, first impressions | Sets booth atmosphere |
| Banner Stands | Highlighting products or offers | Flexible, easy to reposition |
| Floor Graphics | Guiding booth flow | Boosts engagement |
| Digital Displays | Demonstrating innovation | Enables interactivity |
| Structural Graphics | Creating immersive environments | Enhances sensory experience |
Key considerations for each type:
- Durability across multiple shipments and shows
- Visibility from 10 to 50 feet away on a crowded show floor
- Modularity allowing reconfiguration for different venues
- Brand consistency across all graphics and materials
- Installation ease to minimize setup time and costs
The most effective exhibits use complementary graphics that guide attendees through a visual journey, not a single dominant graphic doing all the work.
Modular graphics make sense for frequent exhibitors. They reduce shipping costs, allow quick refreshes between shows, and let you adapt messaging for different regional events. Strategic graphic decoration and exhibition stand lettering balanced with your budget ensures professional quality without excessive spending.
Pro tip: Start with one strong backdrop graphic and one digital display, then layer in supporting banners and floor graphics. This approach balances impact with cost and keeps your booth from feeling cluttered or overwhelming.
Strategic Functions and Brand Engagement
Exhibit graphics do far more than fill wall space. They work behind the scenes as powerful engagement tools that drive conversations, build connections, and convert casual booth visitors into qualified leads. Think of them as the visual language your brand uses to speak directly to attendees’ needs and desires.
Well-designed graphics serve multiple strategic purposes simultaneously. They grab attention in a chaotic environment, tell your brand story in seconds, and create emotional connections that inspire action. For tech companies, this means graphics must demonstrate innovation while building trust.
How Graphics Drive Engagement
Clear messaging hierarchy guides attendee attention to what matters most. When someone walks into your booth, their eye should immediately land on your primary message, then flow naturally to secondary information. Poor hierarchy confuses visitors and loses their interest within seconds.
Emotional appeal matters as much as information delivery. Graphics that resonate emotionally create memorable experiences. Whether your message is about solving pain points, enabling innovation, or building community, the visual tone sets expectations about your brand.
Storytelling through visuals gives attendees context for your products or services. Rather than listing features, graphics show your solution in action, demonstrate customer success, or highlight your company culture. This narrative approach builds stronger connections than fact-based messaging alone.
Strategic functions of exhibit graphics include:
- Attracting foot traffic through compelling visual design and color
- Communicating value proposition instantly and memorably
- Establishing credibility through professional design and brand consistency
- Facilitating conversations by providing talking points for your team
- Collecting data through interactive graphics or lead capture mechanisms
- Supporting sales follow-up with messaging attendees remember days later
Graphics that spark conversation transform casual booth visitors into engaged prospects who actively seek out your team members.
Building Brand Connection Through Design
Visual consistency across all graphics reinforces your brand identity. When attendees see your booth, website, and marketing materials using the same colors, fonts, and imagery, they develop stronger brand recognition and trust.
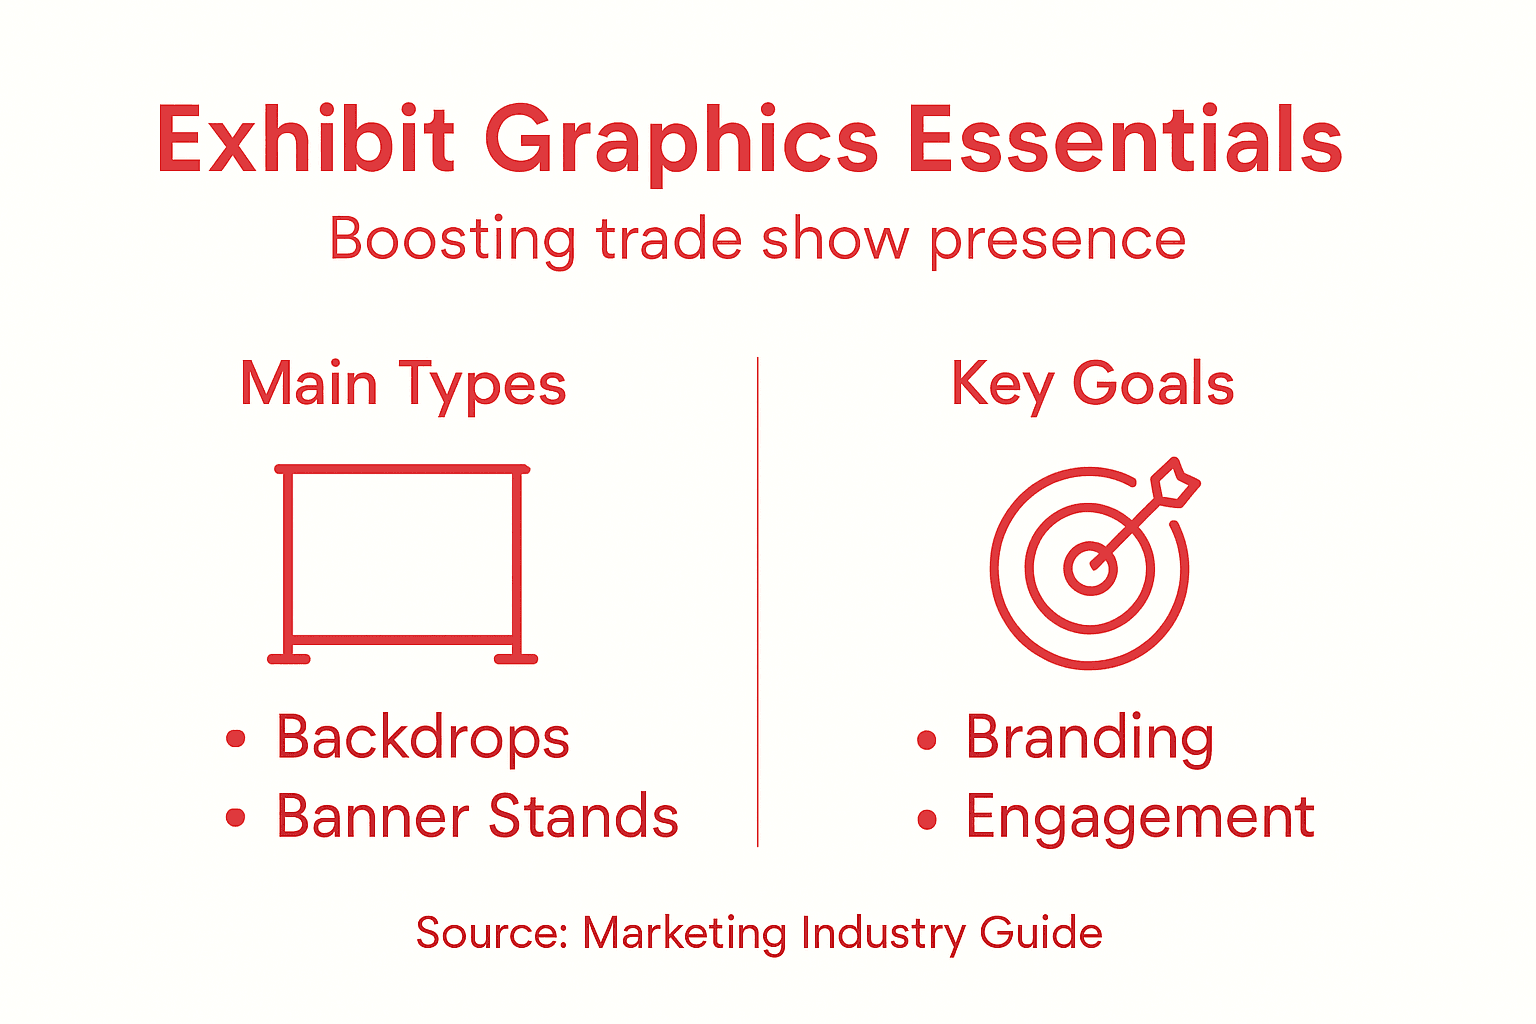
Targeted messaging speaks directly to your ideal customer. A graphics strategy that addresses specific industry pain points or business goals resonates far more than generic messaging. For European tech companies, this might mean highlighting compliance, sustainability, or integration capabilities relevant to your market.
Event branding ideas that boost engagement emphasize creating cohesive visual experiences that guide attendees through a journey. Your graphics aren’t isolated elements but coordinated components of a larger narrative.
Design choices that build engagement include:
- Using contrast and color psychology to evoke desired emotional responses
- Incorporating customer testimonials or case studies visually
- Displaying clear calls-to-action telling attendees exactly what to do next
- Using data visualizations to make complex information digestible
Pro tip: Test your graphics with someone unfamiliar with your company. They should understand your core message in under 10 seconds without reading a single word. If they can’t, your hierarchy needs adjustment.
Best Practices for Impactful Graphics
Creating graphics that actually work requires more than artistic talent. You need strategy, clarity, and attention to the practical details that separate memorable booths from forgettable ones. The best practices below apply whether you’re designing your first booth or your fiftieth.
Start with a single, clear objective for each graphic. When a graphic tries to communicate multiple messages equally, none resonate. Your attendees have seconds to decide whether to stop or move on, so make every element count.
Mastering Visual Hierarchy and Clarity
Visual hierarchy determines what attendees see first, second, and third. Use size, color, and positioning to guide the eye naturally through your message. Your most important statement should dominate, not compete with supporting information.
Contrast makes elements pop and improves readability from a distance. High contrast between text and background ensures legibility from 10 to 30 feet away. Low-contrast designs fail spectacularly on busy trade show floors.
Typography must be readable, not decorative. Choose two to three complementary fonts maximum. Sans-serif fonts work better at distance than decorative or script fonts. Test your text size by standing 20 feet back from your design mockup.
Key hierarchy principles:
- Primary message occupies 40-50% of visual space
- Secondary information gets 30-40% of space
- Supporting details use remaining 10-20% of space
- Whitespace prevents cluttered, overwhelming designs
Quality Materials and Durability
High-quality fabrication maintains your graphics’ appearance throughout shipping, setup, and multiple shows. Budget for durable materials that resist fading, scratching, and weather exposure. Cheap graphics look cheap, damaging your brand perception immediately.
Material choices impact durability and visual appeal:
- Vinyl banners offer excellent durability and color vibrancy
- Fabric graphics provide a premium look with minimal weight
- Rigid substrates (foam, composite, acrylic) enable creative 3D designs
- LED-backlit panels add sophistication and draw attention
Quality materials signal professionalism and investment in your brand, influencing how attendees perceive your company’s reliability and success.
Interactive and Immersive Elements
Interactive graphics deepen engagement beyond passive observation. Touchscreen displays, QR codes leading to resources, or graphics designed for photo opportunities create memorable experiences attendees share on social media.
Immersive design wraps attendees in your brand story. Consider how graphics work together across walls, floors, and ceilings to create an environment rather than a collection of signs. This approach particularly resonates with tech companies showcasing innovation.
Incorporate engagement through:
- Call-to-action graphics directing attendees to specific booth activities
- Data visualizations making complex information instantly digestible
- Customer success stories displayed visually with testimonials
- Interactive product displays integrated with supporting graphics
Pro tip: Create a visual design standard document for your company before designing booth graphics. Include approved color palettes, fonts, spacing rules, and logo treatments. This ensures consistency across all exhibits and reduces design revision cycles.
Measuring ROI and Common Pitfalls
Most marketing managers struggle to justify trade show spending to leadership. They know exhibits drive results, but quantifying those results feels impossible. The truth is simpler: you measure ROI by tracking the right metrics from day one and avoiding predictable mistakes that tank your returns.
Effective ROI measurement starts before your booth goes up. You need clear objectives, tracking systems, and a realistic timeline for measuring impact. Trade show ROI rarely appears overnight, but it compounds significantly over time.
Tracking Quantitative Metrics
Lead generation is the most straightforward metric to track. Count qualified leads captured at your booth, note their quality level, and track conversion rates weeks later. This connects booth activity directly to sales pipeline growth.
Sales conversions attributable to trade shows require discipline. Tag all leads from a specific show in your CRM system. Then track how many converted to customers and the deal value. This reveals whether your booth attracted serious prospects or just tire-kickers.
Brand exposure reaches beyond immediate sales. Track booth traffic, photo social media mentions, press coverage generated, and website visits during and immediately after the show. These metrics reveal broader market awareness impact.
Key quantitative metrics to track:
Below is a quick summary of metrics used to measure trade show ROI:
| Metric | What It Shows | How to Track |
|---|---|---|
| Qualified Leads | Sales pipeline growth | CRM entries |
| Booth Traffic | Brand visibility | Foot traffic counter |
| Conversion Rate | Lead quality | Post-show results |
| Cost per Lead | Marketing efficiency | Expense vs. leads |
- Number of leads captured with contact information
- Lead quality score based on company size, industry, and buying stage
- Conversion rate from lead to qualified opportunity
- Average deal value from trade show sourced deals
- Booth traffic counted by your team or professional counter
- Cost per lead calculated by dividing total exhibit costs by leads generated
Avoiding Critical Pitfalls
Unclear objectives doom exhibits from the start. Before designing graphics, decide: Are you launching a product, building awareness, generating leads, or strengthening relationships? Different goals require different booth designs and metrics.
Underestimating total costs inflates your ROI calculations dangerously. Include graphics, booth rental, shipping, setup labor, staff time, travel, and follow-up costs. Hidden expenses shrink profit margins significantly.
Neglecting post-show follow-up wastes your entire investment. The leads you capture mean nothing if your sales team never contacts them. Establish follow-up processes before the show ends.
Your most expensive mistake isn’t failing to attract leads—it’s failing to follow up with the leads you attracted.
Overlooking long-term value means missing the real ROI story. Trade shows build relationships that convert months or years later. B2B sales cycles are long; don’t judge success by immediate conversions alone.
Common pitfalls to avoid:
- Setting no specific objectives before the show
- Failing to track leads systematically in your CRM
- Underestimating event expenses during ROI calculations
- Neglecting to follow up with captured leads within 48 hours
- Judging success only on immediate sales, not pipeline growth
- Not comparing year-over-year results from the same shows
Building Your Measurement Framework
Establish tracking systems that work for your team. Use your CRM to tag all trade show leads, create a simple spreadsheet to track booth metrics, and set up automated email sequences for follow-up. Simple systems get used; complicated systems get abandoned.
Compare results against benchmarks. First-time exhibitors typically see 2-3 leads per thousand booth visitors. Experienced exhibitors with strong graphics and messaging convert 4-6 leads per thousand visitors. If you’re below industry benchmarks, your graphics or messaging needs improvement.
Pro tip: Set up your CRM tracking and follow-up sequences two weeks before the show, not after. Test them with practice leads so your team knows exactly what to do when real leads arrive. Bad follow-up systems waste everything else you’ve invested.
Elevate Your Trade Show Presence with Expert Exhibit Graphics Solutions
Trade shows offer a critical chance to capture attention and convey your brand’s innovation instantly. As highlighted in the article, challenges like creating clear visual hierarchy and combining engaging digital displays with durable banner stands can feel overwhelming. The pressure to convert casual visitors into qualified leads requires exhibit graphics that balance visual impact, strategic messaging, and brand consistency to effectively communicate your European tech company’s story.
At Adam Expo Stand, we understand these demands and specialize in delivering custom and modular exhibition stands tailored to your unique marketing goals. Whether you need striking backdrops, interactive digital displays, or coordinated floor graphics that guide visitor flow, our end-to-end service covers conceptual design, 3D visualization, fabrication, and on-site assembly to bring your vision to life. Explore how our sustainable and reusable exhibit solutions can maximize your trade show ROI while reinforcing your brand identity.
Ready to transform your trade show impact with exhibit graphics that truly engage your audience? Visit Adam Expo Stand today to start creating a booth experience that turns attendees into lifelong customers. Discover more about custom exhibition stand design and learn how our turnkey services make executing your marketing strategy simpler and more effective.
Frequently Asked Questions
What are exhibit graphics?
Exhibit graphics are visual components designed for trade show environments, including backdrops, signage, banners, and digital displays. They communicate your brand story and attract the attention of attendees.
Why are exhibit graphics important for trade shows?
Exhibit graphics play a crucial role in capturing attention in a crowded environment, conveying complex information quickly, and creating memorable experiences that reinforce your brand identity.
What are the different types of exhibit graphics?
The main types of exhibit graphics include backdrops and wall graphics, banner stands, floor graphics, digital displays, and custom structural graphics, each serving unique purposes to enhance booth engagement.
How can I measure the effectiveness of my exhibit graphics?
Measure the effectiveness of your exhibit graphics by tracking metrics such as lead generation, booth traffic, conversion rates, and brand exposure. Establish clear objectives and systematize follow-up processes for leads captured during the event.


